
"Coffee filters... falling!" lab
With the whole team away on lab day aside from one lonely member of The Yellow Team, there was no other option than having to join with the "G-Force" to accomplish the lab. In this lab, we were to determine how terminal speed is affected by the mass of an object. At first the "G-Force" plus sole member of the Yellow Tape team, hypothesized that the terminal speed of an object with a greater mass has more terminal velocity than an object with a lighter mass, therefore falling faster.
The procedure of this lab is as follows;
First is to gather all the required materials for this lab. The materials needed are; 5 coffee filters, a motion sensor, handheld explorer, meter stick and a device that can record video. You will be analyzing data with the motion sensors recorded data, along with Tracker videos.
Now first, you want to find an area where you can stand high up away from the motion sensor as much as possible ( 2.5 ft max) along with a coffee filter in your hand.
What you want to do next is, with 1 filter only, drop the filter at a maximum height achievable (2.5 ft max) with one person controlling the handheld explorer and one recording all the drops, to record video/motion sensor data as soon as the filter is dropped to the moment where the filter touches/passes the motion sensor. Make sure you place a meter stick in the frame of your video recording, so there is a sense of displacement in the tracker program. Try to get the filter to land as close to the motion sensor as possible. Repeat dropping the 1 filter from the same height as before this time aiming to hit the center of the sensor. If already achieved a trial where the filter landed well on the sensor then no more trials are needed to be done, else wise take up to three trials for each set of filters. Now repeat all this but with 2 filters together inside each other at the same height, taking three trials max. Repeat till 4 filters stacked together have been dropped and have successfully hit the sensor. At the end of this repetition, there should be a max of 12 trials of data in the handheld explorer, 3 for each set of filter stacks.
Now connect the handheld explorer to the computer and retrieve all the information from the explorer via explorer program and take the numerical data and paste to excel. Also, in the tracker program, upload the videos of each set ( best trial from each set, so 4 videos in total) and make the data accessible by going through all the steps to make a tracker video. You should notice that the data from your tracker project should be similar to the data recorded by the motion sensor.
Using the law of physics learned so far in class (Formulas etc...) find the velocity of each set at each data point of the coffee filters from both motion sensor and tracker data. From both data retrieving ways, you should see there is a time at where the filter falls at a constant velocity; this is the point where the filter has reached its terminal speed, speed at which it cannot go any faster.
In conclusion, we saw that as more filters were stacked together, the terminal speed was approached faster and therefore fell faster down than just 1 filter by its self. This is view able from the data recorded by the motion sensor that 1 filter alone took more time to fall than 4 filters together. This can state that objects with higher masses approach terminal speed quicker.
By using the data collected from the Tracker videos, we found that there was a point where the velocity of the filter remained about constant till the end of the motion. The data of the sensor compared to the tracker was a bit different since the tracker was more precise than the motion sensor and its beam. Also air resistance was a big factor that displayed different data than tracker, since that ignores air resistance. Therefore, calculating instantaneous velocities using sensor data, different results were given off. Other then that, fairly similar times and displacements were given from both methods.
Experimental and systematical errors that may have occurred during the process of this experiment that affect data were mainly the filters. The filters sometimes did not land perfectly onto the sensor, therefore generating wrong data points. Also, the filters while falling swayed sometimes, making the sensor think the filter had moved away from the beam, generating wrong data points. Another error may have been that the displacement was not always the same due to slight increase/decrements in hand movement. One way to decrease such random errors would be to constrain the amount of space the filter has on its sides limited to the area of the motion sensor. Also, having a set point of displacement would result in more accurate results.
Data Below
1st filter data
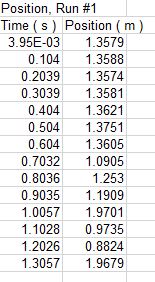
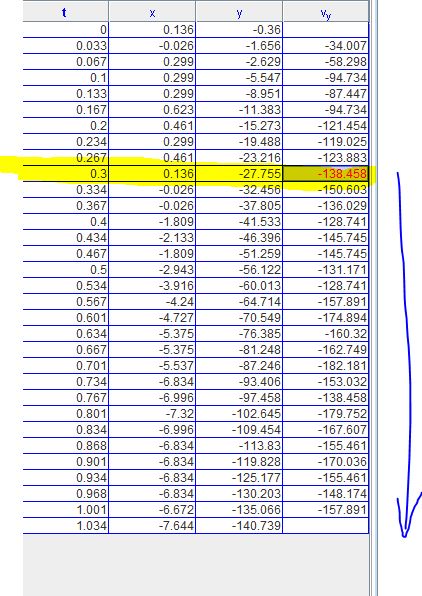
Position of coffee filter in meters related to time in seconds.
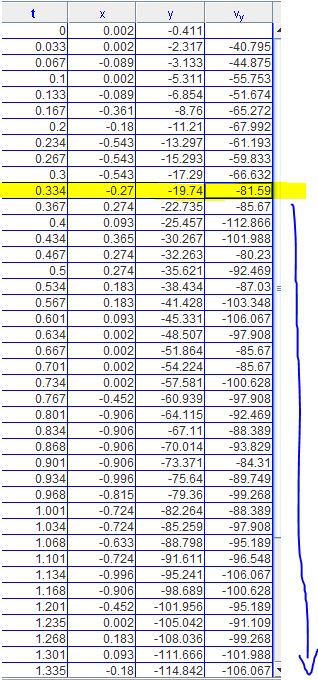
At about 0.334 seconds, terminal speed was achieved as the velocities after seemed to range close together. (Velocity shown in cm/s)
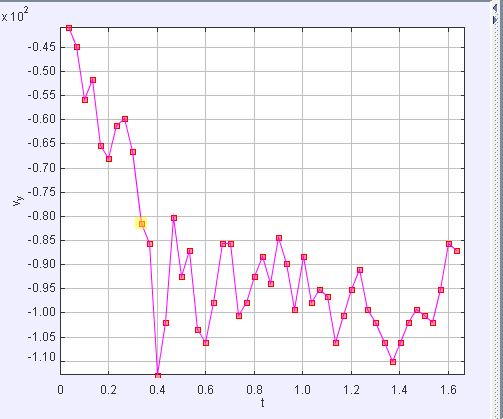
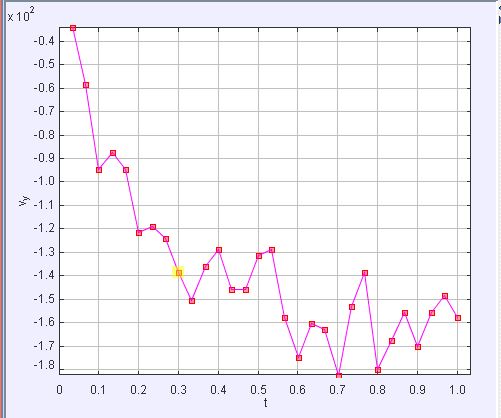
Velocity- Time graph of data, showing yellow point being where terminal speed is supposedly achieved. (Velocity in cm)
2 filters data
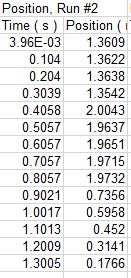
Position of coffee filter in meters related to time in seconds
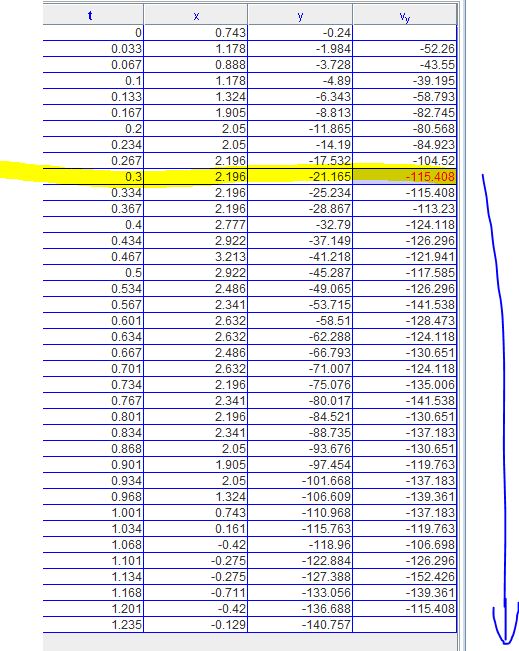
At about 0.3 seconds, terminal speed was achieved as the velocities after seemed to range close together (Velocity shown in cm/s)
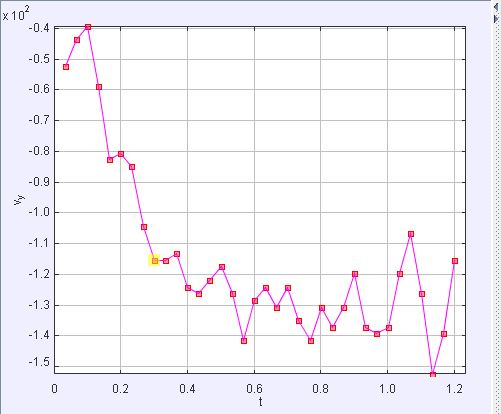
Velocity- Time graph of data, showing yellow point being where terminal speed is supposedly achieved. (Velocity in cm)
3 filters data
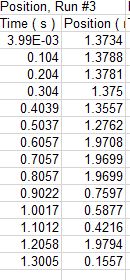
Position of coffee filters in meters related to time in seconds
At about 0.3 seconds, terminal speed was achieved as the velocities after seemed to range close together (Velocity shown in cm/s)
Velocity- Time graph of data, showing yellow point being where terminal speed is supposedly achieved. (Velocity in cm)
4 filters data
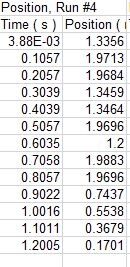
Position of coffee filters in meters related to time in seconds
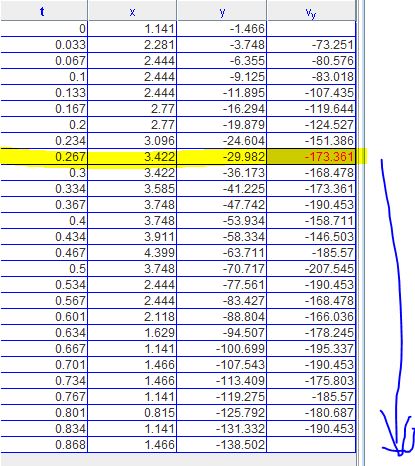
At about 0.267 seconds, terminal speed was achieved as the velocities after seemed to range close together (Velocity shown in cm/s)
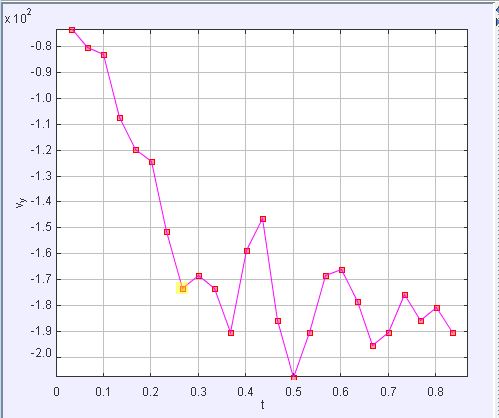
Velocity- Time graph of data, showing yellow point being where terminal speed is supposedly achieved. (Velocity in cm)
